Search for more information
Auto alignment, tracking, and capture Detailed patient summaries 10.4” LCD touchscreen display Motorized chinrest Software to view results in your exam lane EMR/EHR integration
Corneal SA for Aspheric IOL Selection Lenticular – Residual Astigmatism Angle Kappa/Angle Alpha Corneal coma for multifocal IOL qualification Pre/Post Toric IOL Measurements Pathologies (Keratoconus, Pellucid) Mesopic/Photopic Pupil Size Retro Illumination Image Zernike Graphs: Total, Cornea, Internal Corneal Refractive Power Map
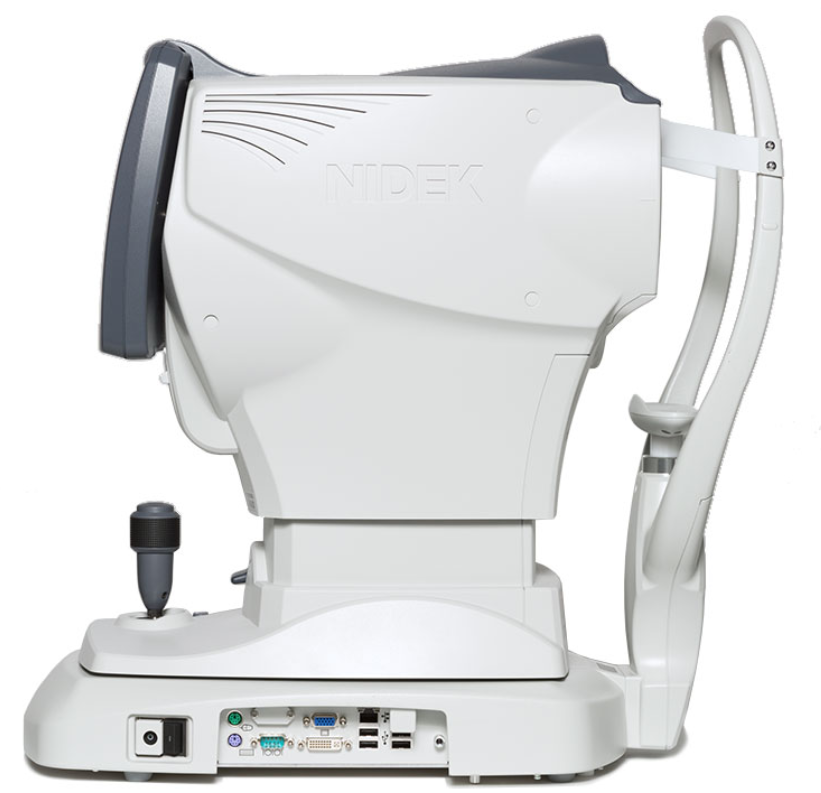
286 (W) x 525 (D) x 530 (H) mm 23kg
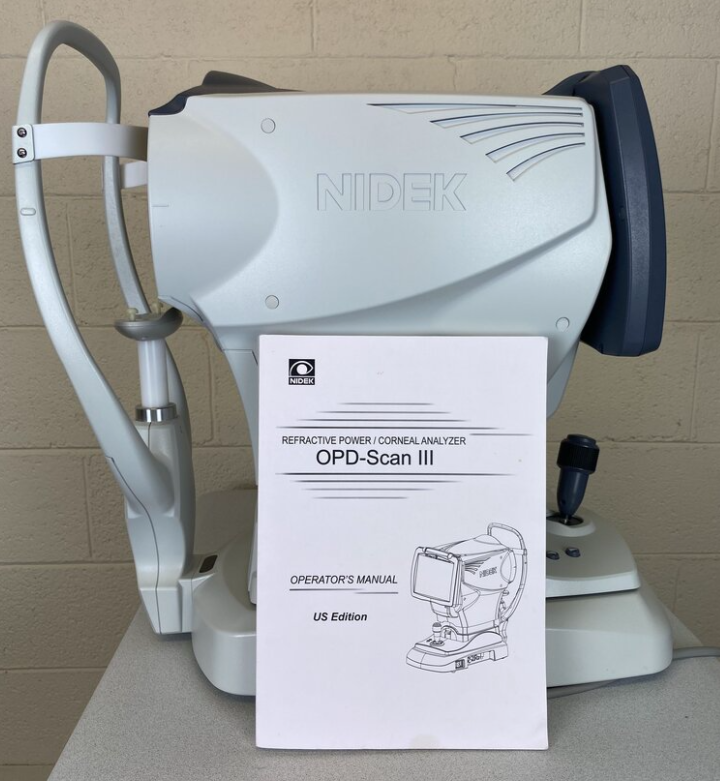
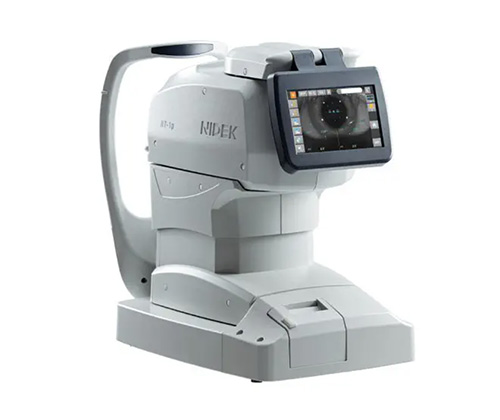
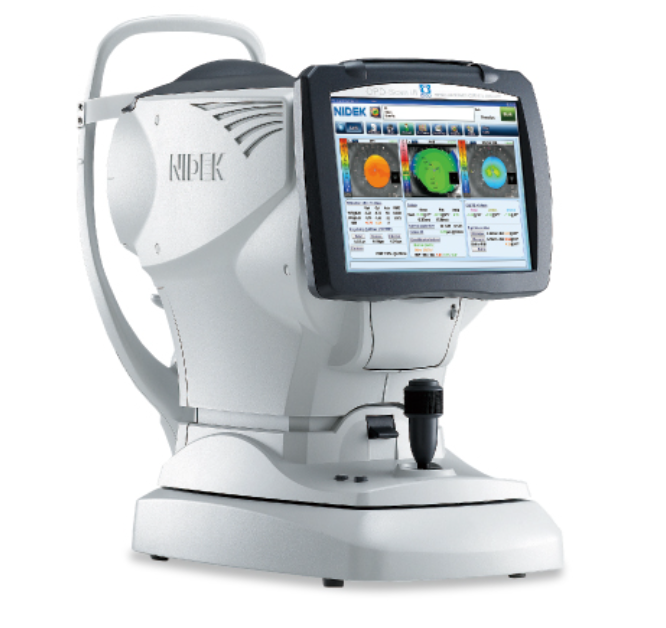
#Nidek OPD-Scan III and Nidek OPD-Scan III VS Corneal Analyzer is an automated 5 in 1 instrument that combines topography, wavefront, autorefraction, keratometry, and pupillometry — allowing accurate and reliable analysis of corneal aberration.

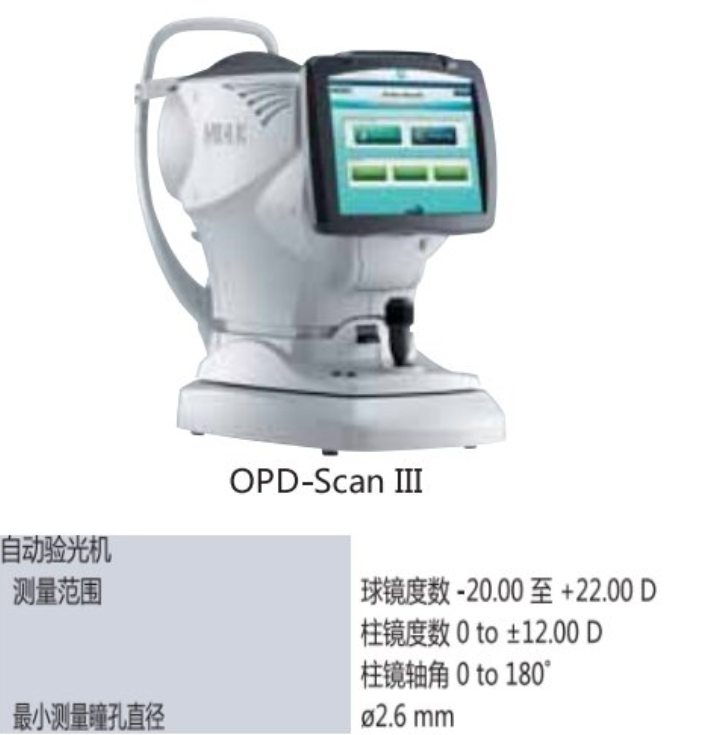
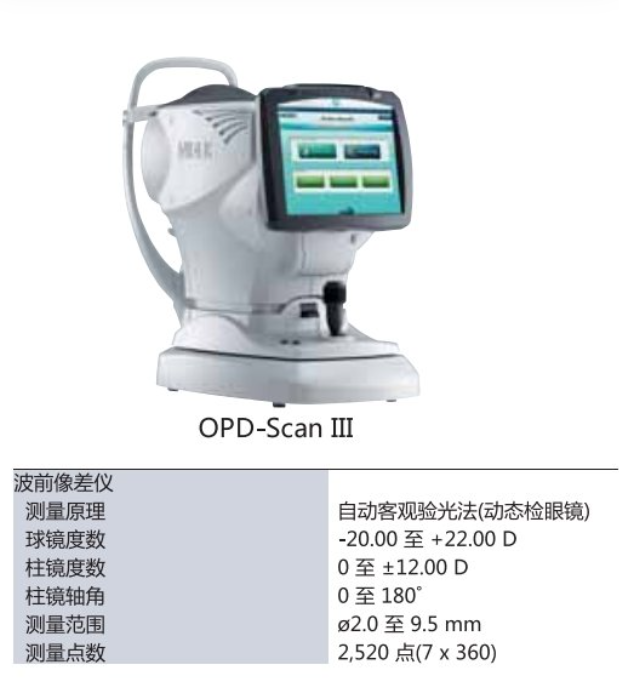
OPD-Scan III Wavefront Aberrometer
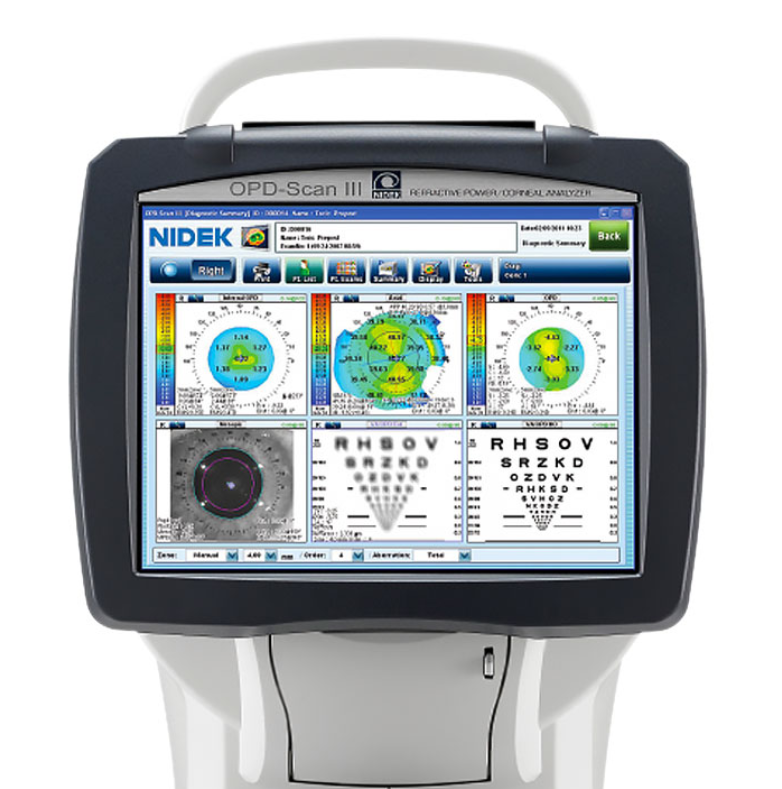
The Marco OPD-Scan III is an autorefractor, keratometer, pupillometer (up to 9.5mm), corneal topographer, and integrated wavefront aberrometer. It can complete 20 diagnostic metrics in less than 10 seconds per eye (including angle kappa, angle alpha, HOAs, average pupil power, RMS value, and point spread function). Plus, easy and automatic alignment and data capture ensures accurate results.
Features:
Auto alignment, tracking, and capture
Detailed patient summaries
10.4” LCD touchscreen display
Motorized chinrest
Software to view results in your exam lane
EMR/EHR integration
Measurements:
Corneal SA for Aspheric IOL Selection
Lenticular – Residual Astigmatism
Angle Kappa/Angle Alpha
Corneal coma for multifocal IOL qualification
Pre/Post Toric IOL Measurements
Pathologies (Keratoconus, Pellucid)
Mesopic/Photopic Pupil Size
Retro Illumination Image
Zernike Graphs: Total, Cornea, Internal
Corneal Refractive Power Map

IOL Applications
APP – Average Pupil Power for post myopic LASIK calculations
Angle Kappa, Angle Alpha
Corneal aberrations including corneal coma and spherical aberration
Pupillometry – photopic and mesopic pupils
Corneal topography
Placido Rings for detection of any ocular surface disease (OSD)
Zernike graph of total, corneal, and internal aberrations
White to white corneal diameter measurements
Retro illumination – displays post-op Toric lens markings, opacities, etc.
ECCP – Effective Central Corneal Power for IOL power calculation
Toric IOL summary to mark axis pre-op
Eye image can allow for marking the cornea based on landmarks
Cataract summary displays the pertinent data together
Point spread function graphs and VA simulation charts
Fast, Accurate Diagnostics
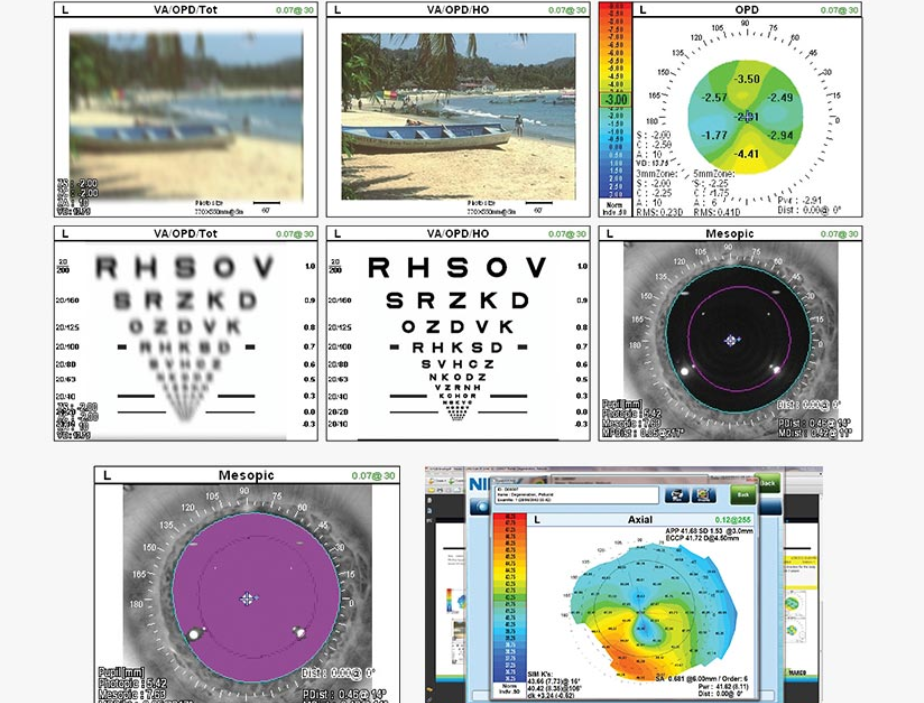
Over 20 diagnostic measurements are acquired in 10 seconds with the OPD-Scan III. Easy alignment and automatic capture of data ensures accurate readings. Wavefront data is gathered with 2,520 light vector data points from available zones up to a 9.5mm area, adding the capability to provide for calculation of mesopic refractions. Corneal topography is gathered across 11mm with 11,880 data point mapping. Blue light, 33 ring, placido disc topography is gathered in one second.
Data View Options
Axial
Gradient
Instantaneous
Numeric K display
Numeric power display
PSF (point spread function)
Zernike graph (including corneal)
Contact lens summary
VA-ETDRS simulations
Internal OPD
Eye image
Comparison maps
Difference maps

Unique Features for Cataract & Refractive Surgery
Detailed patient summaries are available in just a matter of seconds. Pre-op toric axis alignment can be mapped to iris or other physical landmark positions. Retro illumination images can be used post-op to verify IOL axis alignment.
Dysfunctional Lens Syndrome (DLS)
The map pictured is a measurement of a prior myopic LASIK patient with Dysfunctional Lens Syndrome (DLS). The Point Spread Function (PSF) maps show that the cornea is contributing to the problem, but the majority of the patient’s issue is lenticular change. The patient thought she needed another LASIK treatment, when in actuality, the lens has changed. A refractive lens exchange is recommended.
Day/Night Wavefront Refractions
Pupillometry measurements are utilized to allow for the calculation of separate wavefront refractions at 4mm and 6mm zones (or mesopic if smaller than 6mm). This provides information on the stability of the refractive error as pupil size changes, and the individual starting points for separate day and night refractions, if indicated. Your patients can receive a state-of-the-art printout of their ‘before’ and ‘after correction’ chart or understand why they are not able to achieve 20/20.
Power Mapping
Spherical Power Range
-20.00 to +22.00 D
Cylindrical Power
0.00 to ±12.00 D
Axis
0 to 180°
Measurement Area
2.0 to 9.5 mm (7 zone measurement)
Data Points
2,520 points (7 x 360)
Measuring time
< 10 seconds
Measurement Method
Automated objective refraction (dynamic skiascopy)
Mapping Methods
OPD, Internal OPD, Wavefront maps, Zernike graph, PSF, MTF graph, Visual Acuity Corneal Topography
Measurement Rings
33 vertical, 39 horizontal
Measurement Area
0.5 to 11.0 mm (r = 7.9)
Dioptric Range
33.75 to 67.5 D
Axis Range
0 to 359˚
Data Points
More than 11,880
Mapping Methods
Axial, Instantaneous, “Refractive”, Elevation, Wavefront maps, Zernike graph, PSF, MTF graph, Visual Acuity General Information
Working Distance
75 mm
Auto Tracking
X-Y-Z directions
Observation Area
14 x 11 mm